Principles of Nulling and Imaging Ellipsometry
INTRODUCTION
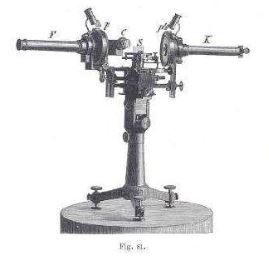
Principles of Nulling and Imaging Ellipsometry INTRODUCTION Ellipsometry is a very sensitive optical method, which has been used for about a hundred years to derive information about surfaces. It makes use of the fact that the polarization state of light may change when the light beam is reflected from a surface. If the surface is covered by a thin film (or a stack of films), the entire optical system of film & substrate influences the change in polarization. It is therefore possible to deduce information about the film properties, especially the film thickness. The name ”ellipsometry” implies that it has something to do with an ”ellipse”: The elliptical state of polarization, where the electrical field vector travels along an ellipse when observed at a fixed point in space, is the most general state of polarization. The basic components of an ellipsometer are: a light source, some optical components to modify the polarization and a detector. By using imaging technology, one can extend the classical ellipsometer to a new form of visualization tool or a microscope with extreme sensitivity to thin films.
Figure 1. Historical setup of an ellipsometer [Paul Drude, Lehrbuch der Optik, Leipzig, 1906]
POLARIZATION OF LIGHT
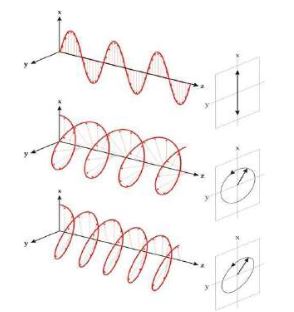
Light is an electromagnetic wave. In order to describe light one considers the strength and direction of the electric field E, because this has a stronger interaction with matter than the magnetic field. Monochromatic light may, at a point in space E, be resolved into three independent harmonic oscillations along an x,y,z-coordinate system. If the light wave is a plane wave that travels along the z-axis, the E vector is always orthogonal to z, thus it can be described by two harmonic oscillations along x and y. These oscillations have the same frequency, but generally different amplitude and phase. As a result, the E vector moves along an ellipse at a fixed point in space. The behavior with time of a vector field at a fixed point in space is called polarization. Thus, the most general polarization of (monochromatic) light is elliptical. If the phase of the x and y oscillations is equal, the resulting ellipse degenerates into a straight line. If the phase difference is +/-90° the ellipse becom es a circle. Thus, linear and circular polarization are specialized cases of the general elliptical state. For all other phase differences, a "true” ellipse evolves.
THE PROPER COORDINATE SYSTEM
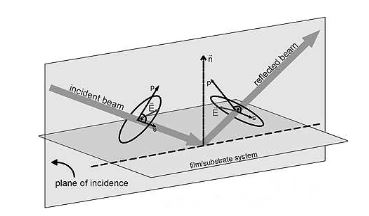
If a light beam illuminates a surface under obligue incidence, a plane may be defined by the wave vector K pointing in the direction of travel of the light and the surface normal n. This is called the plane of incidence. It is now common to define the direction of x and y in such a way that x is parallel to the plane of incidence and y is perpendicular. These directions are referred to as p (for parallel) and s (for perpendicular) which replace the x,y notation. Thus, the electric field E is resolved into its p and s components.
Figure 2. Polarization state of light
REFLECTION AT SURFACES
The light is reflected by the surface(s) of the sample. The sample may constitute a complex optical system with various layers of different optical properties. Multiple reflection at the interfaces of the layers superimpose to finally form the reflected light wave with an altered state of polarization. In particular, the p and s components will undergo different overall phase shifts and also exhibit different reflective properties. Thus, the shape and the size of the ellipse of polarization are changed. This change again is a measure of the properties of the optical system (sample). The incident and reflected E vectors are connected by the reflection matrix R of the sample:
The concept of ellipsometry is to measure the change of the polarization state of the light wave to obtain information about the sample (the matrix R). Note that there are many different ways to do ellipsometry, with the nulling ellipsometry described below being only one of the possibilities.
Figure 3. Reflection from the sample (film/substrate system) changes the ellipse of polarization.
OPTICAL COMPONENTS USED FOR ELLIPSOMETR
The main optical components used in most types of ellipsometers are polarizers and retarders. A polarizer is a component that produces light in a special state of polarization at the output. Especially linear polarizers are very common components. They work by suppressing one component of the incident light, thus allowing only the other component to pass. By rotating such a polarizer, one may produce from unpolarized incident light a beam of linearly polarized light with the direction of polarization corresponding to the angle of rotation of the axis of the polarizer. If the incident beam is already polarized, the transmitted intensity will depend on the amplitude of the component of E along the axis of the polarizer. In this case the polarizer is called an analyser because it allows one to measure the ratio of the p and s components. Note that two linear polarizers at an angle of 90° do not transmi t light (”crossed polarizers”, ”no transmission” typically means a remaining background of 10 -6 )
Beside the polarizers there are optical retarders. They are used to shift the phase of one component of the incident light. A typical retarder is a "quarter- wave plate” which has a ”fast” and a ”slow” axis leading to a phase shift of 90° in the components of E along these axes. Depending on the orientation of the quarter-wave plate it transforms the ellipse of polarization, e.g. linearly polarized light into circularly polarized light when set to 45° in respect to the linear polarization axis. With a not very strict nomenclature these retarders are often called compensators, as we will also do. For the following it is important to understand that the combination of a linear polarizer P and a quarter-wave compensator C (PC) in rotatable mounts can act as a variable polarization filter that can generate any desired elliptical state of polarization at the output (provided that the s and p amplitude are equal at the input).
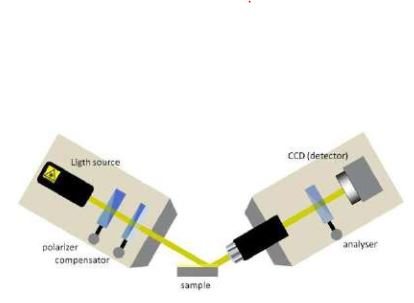
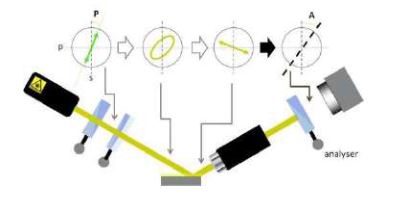
Figure 4. Setup of a nulling imaging ellipsometer
NULLING ELLIPSOMETRY
When linearly polarized light with an axis pointing anywherebut in the s or p direction is incident on a sample, the reflected light will in general exhibit an elliptical state of polarization. The other way around, the same elliptical state of polarization (but with a reversed sense of rotation) incident on a surface will generate a linearly polarized reflection. More generally, using the PC combination mentioned above one can always find an elliptical polarization that produces a perfect linearly polarized reflection (if the sample is not depolarizing). This has a nice consequence: one can easily detect this particular state by using a second polarizer as an analyzer in the reflected beam. For a linearly polarized beam it is possible to extinguish the beam by setting the analyzer to a 90° position with respect to the axis of the linear polarization. This is called ”finding the Null” or ”nulling”. In practice this is equivalent to finding a minimum in the signal of a photo-detector.
Thus we have a recipe for a nulling ellipsometer in a PCSA arrangement:
1. Let light pass through a PC combination, while recording the angular setting of P and C.
2. Change P and C in such a way that the reflection from the sample S is linearly polarized.
3. Use a photo-detector behind an analyzer A to detect this as a minimum in the signal.
Iterative routines can be found that allow one to actually find the right angle settings for P, C and A to fulfill the Null condition. The most commonly used method is the so-called ”fixed compensator nulling scheme” which means that the compensator is fixed at a certain angle and that P and A are rotated. It can be shown that a rotation of P followed by a rotation of A while keeping P at its minimum signal position leads to a Null. This procedure has to be repeated iteratively to obtain the desired accuracy. One advantage of nulling ellipsometry is the fact that one measures angles instead of light flux, thus partly avoiding problems of the stability of the light source or non-linearity of the detectors.
Figure 5. State of pollarisation during nulling ellipsometry.
OPTICAL MODELING
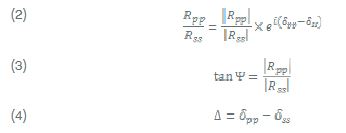
For isotropic materials, where R is diagonal (R sp , Rps = 0), two so-called ellipsometric angles and can be defined, describing the ratio of the complex reflection coefficients R pp and Rss , which are actually measured by the ellipsometer:
Ψis an angle which tangent gives the ratio of amplitude change for the p and s components, while denotes the relative phase shift of the p and s component upon reflection.The result of nulling is a set of angles of P, C and A. There are formulas that relate these numbers to the ellipsometric angles Δ and Ψ and thus to the reflection matrix R. Symbolically:
However, most people are not interested in R itself. Moreover, they wish to know physical quantities of the sample under examination, for example the thickness of a film on a substrate. In general it is not possible to calculate such quantities directly from the ellipsometric angles, because the formulas that describe R as a function of these parameters are complicated and can not be inverted (except for particular simple cases). Therefore, one has to develop an optical model (i.e. the formula of , as a function of the parameters) and fit the output of the model until it equals the measured values of Δ and Ψ. In terms of the example mentioned, one has to change the film thickness in the model until the resulting values of Δ and Ψ similar to the measured data. This can be a tedious and complicated task, especially if more than one parameter is to be deduced. The optical modeling can be regarded as the most critical point in ellipsometry.
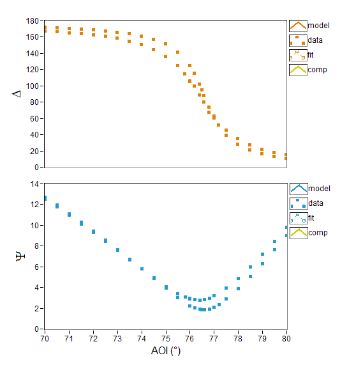
Figure 6. Angle of incident (AOI) spectra of Ψ and Δ : Air | substrate and Air | Surface coating | substrate
As one can see above, a single nulling can lead to two measurable real quantities. Thus it is in principle possible to measure e.g. a complex index of refraction or the real index of refraction plus a film thickness or another combination of two real numbers (if the system is "well-behaved).
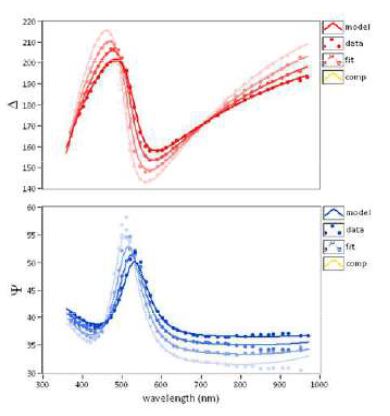
However, often one needs to measure more than this, e.g. two thicknesses plus two refractive indices for a double layer system. To accomplish this task one needs to increase the number of independently measurable quantities. This can be done for instance by doing multiple-angle-of-incidence measurements. Another way is to measure at different wavelengths, where each wavelength introduces a new unknown refractive index (due to dispersion) but provides two new values for Δ and Ψ. This leads to spectroscopic ellipsometry. However, even though all this may seem simple at first glance, it requires very extensive mathematical apparatus and a lot of numerical calculus, together with managing experimental obstacles, so that finding of all unknowns for a multilayer system remains a very tricky task. Indeed, it gets even more complicated when the sample is anisotropic, as R will not be diagonal then. In this case the definitions of Δ and Ψ are not sufficient and have to be extended. This takes us to the field of Generalized Ellipsometry, which is far beyond the scope of this introduction.
Figure 7. Wavelength spectra of Ψ and Δ. at different AOI – air | graphene | SiO2 | Si.
IMAGING ELLIPSOMETRY
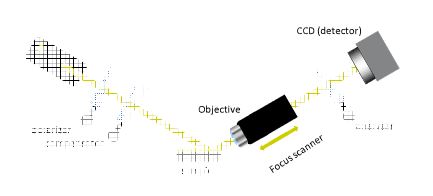
To add imaging to an ellipsometer one mainly needs an objective and a spatially resolving detector, e.g. a sensitive CCD camera. The objective images the illuminated area of the sample onto the camera. As a consequence, areas that have different optical properties cause a different signal in the camera image. Especially those areas that are currently fulfilling the condition of the ellipsometric "Null”, i.e. where the optical parameters are such that the light reflected is extinguished for that particular setting of P, C and A, and will appear dark in the image.
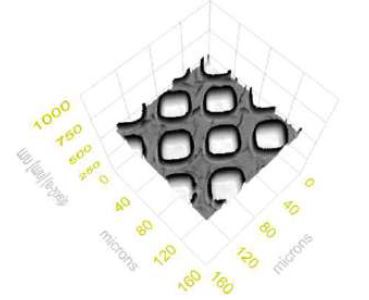
Where this condition is not met higher light intensities are incident at the detector, producing brighter image regions. Changing the settings of P,C, and A it is now possible to find the Null for these regions, which will cause the former dark areas to appear bright. The main advantage of such an imaging ellipsometer is that the signal one gets is not the average over an entire laser beam spot on the sample, but spatially resolved to show the details of the sample. This is very valuable information, because often the sample will exhibit a lateral structure, wanted or unwanted. With the Imaging Ellipsometer one not only gets immediate qualitative information but it is also possible to restrict ellipsometric analysis to a particular region of interest within the field-of-view. Applying proprietary algorithms allows one to map the Nulls for the entire image, if necessary. This yields a two-dimensional map of the ellipsometric data that can be transformed into a thickness map of the sample or another quantity.
Figure 8. Additional optical components of an imaging ellipsometer.
THE SCANNER
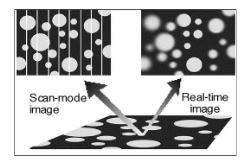
A general problem of Imaging Ellipsometry is the inclined observation angle. Thus, only a limited area of the image appears to be well-focused when using conventional optics. The Imaging Ellipsometer overcomes this limitation by using a motorized focusing mechanism to collect a series of images with different foci within the field-of-view. A digital image processing system then superimposes only the focused parts of an image series, resulting in a digitized image sharp from edge to edge. Since motion of the objects under observation is critical, a variable scanner speed is provided to adapt the system to a wide range of experimental situation.
Figure 9. mapping: Thickness map – air | SiO2 | Si
CONCLUSION
Ellipsometry is a well-known non-destructive optical method for determing film thickness and optical properties. Imaging Ellipsometry combines the power of ellipsometry with microscopy and overcomes the limits of classical ellipsometers.
The Nanofilm Imaging Ellipsometers offer you to study the surface in three steps:
· generating high contrast image from the surface
· ellipsometry with highest lateral resolution (1μm)
· generating of 3D thickness maps
Typical applications are in the triangle between biophysics, surface chemistry and Nanotechnology.
Figure 10. Overall focused images by using a focus scanner.
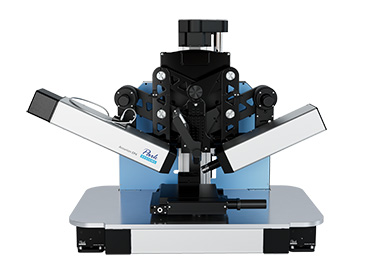
Figure 11. Spectroscopic imaging ellipsometer

