Tapping mode
Tapping mode is a dynamic AFM technique that images the sample topography by scanning the surface with an oscillating cantilever. Similar to Park’s True Non-contact mode, Tapping mode uses the amplitude of cantilever oscillation to detect changes in the tip-sample interaction forces and thereby the sample topography. However, in Tapping mode the cantilever vibrates with larger amplitudes compared to True Non-contact mode and the tip makes intermittent contact with the sample surface during the measurement. The amplitude is used as topography feedback, while the phase lag be-tween drive and detected signal contains information about material-specific mechanical properties.
Figure 1 shows the interatomic interaction potential, the so-called Lennard-Jones potential, which is used as approximation for the tip-sample interaction. At short distances between the atoms, the interaction is governed by short-ranged repulsive forces, mainly due to the Pauli repulsion, which prohibits the overlap of electron clouds of tip and sample. Above a certain threshold, attractive van der Waals forces dominate the interaction. Van der Waals forces originate from dipole-dipole interactions.
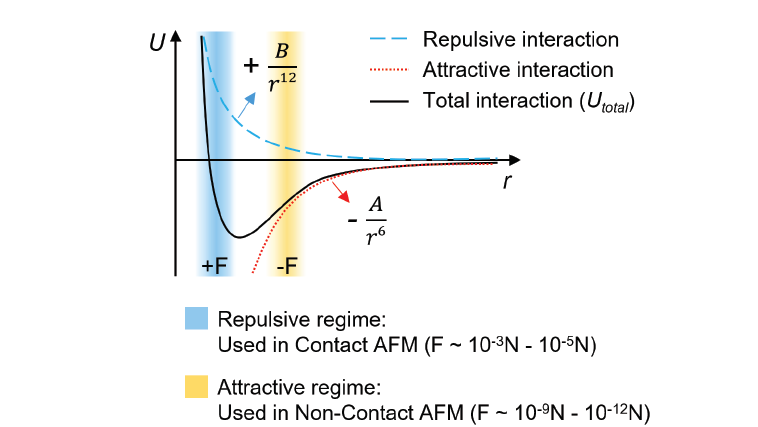
Figure 1. Interatomic interaction potential U vs. distance r as approximation for the tip-sample interaction. The blue curve represents a purely repulsive interaction, while the red curve represents a purely attractive interaction. The black curve is a combination of long-range attractive and short-range repulsive interaction called the Lennard-Jones Potential. At larger distances, the net force is attractive (-F), which switches to a net repulsive force (+F) when two atoms are brought closer.
Tapping mode operates at the transition between the repulsive and the attractive force regime. Different from True Non-contact mode measurement, which operates exclusively in the attractive force regime, Tapping mode is an intermittent contact mode, where the tip makes contact to the surface at the lower turning point of the oscillation and, therefore, enters the repulsive force regime.
For the oscillation in Tapping mode, the cantilever is driven close to its resonance frequency f0. The resonance frequency of the cantilever is given by the intrinsic spring constant k0 and the mass m as shown in equation (1). As the cantilever approaches the sample surface, the resonance frequency shifts. This shift is caused by a change of the cantilever spring constant from its intrinsic value to an effective spring constant keff, written as:
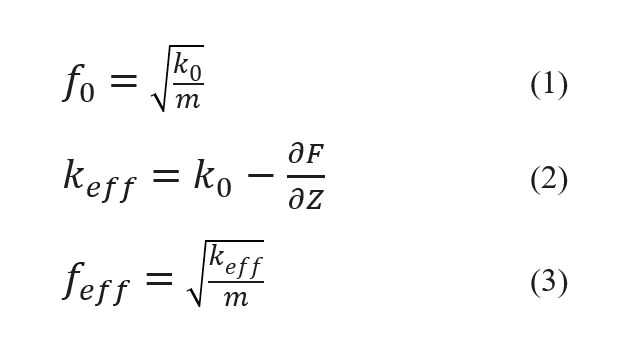
At larger tip-sample distances, where attractive forces dominate, the force gradient F' (=∂F⁄∂Z) is positive and keff becomes smaller than k0 in agreement with equation (2). Accordingly, keff becomes larger than k0 for repulsive tip-sample interaction in proximity of the surface. In Tapping mode, the change of the effective spring constant and, thus, the shift in resonance frequency is detected as a change in the oscillation amplitude. The detection of amplitude changes is more sensitive to the tip-sample distance than changes of the static cantilever deflection.
To introduce the mechanical oscillation of the cantilever a piezo-element with a wide range of frequencies drives the cantilever. The cantilever’s resonance frequency f0 is identified by sweeping the frequency of the drive piezo over certain range and a distinct peak is observed at the resonance. Figure 2 displays the relation between the cantilever’s amplitude and the drive frequency of the cantilever at resonance without interaction forces (a), in the attractive force regime, used for Park’s True non-contact mode (b) and in the transitional force regime between attractive and repulsive forces used for Tapping mode (c).
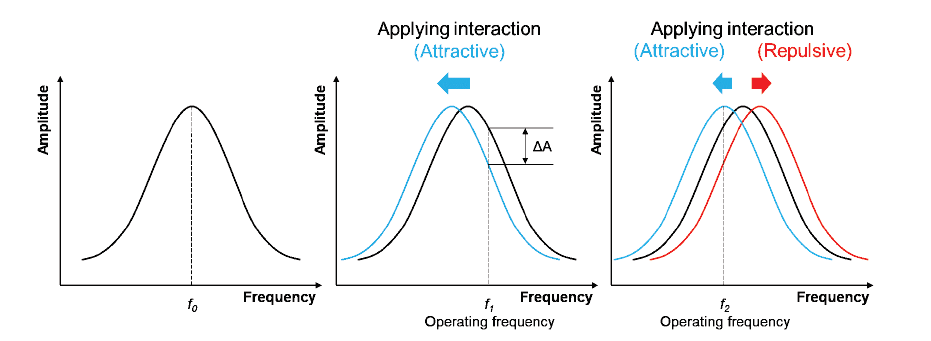
Figure 2. Schematic of cantilever resonance (a) without tip-sample interaction, (b) for Park’s True Non-contact mode operated in the attractive force regime, leading to shift to lower frequencies in blue, and (c) for Tapping mode operated in the attractive and repulsive force regime, leading to a shift to lower and higher frequencies in blue and red, respectively. The detected change in the oscillation amplitude is indicated as ΔA.
For True Non-contact mode the operating or drive frequency f1 is slightly larger than f0, see figure 2(b). As shown in equations (2) and (3) keff decreases with respect to k0 due to the attractive force, leading to a shift of the resonance to lower frequencies and a negative change in the oscillation amplitude ΔA measured at the frequency f1. For Tapping mode on the other hand, the resonance shifts to lower or higher frequencies within one oscillation cycle as the interaction transitions from the attractive to the repulsive force regime, respectively. Here, the operating frequency f2 is typically lower than f0 to detect the positive and negative change of the oscillation amplitude ΔA in the attractive and repulsive force regime, respectively.
Tapping mode uses the oscillation amplitude detected at the operating frequency as feedback signal. The feedback controls the movement of the Z scanner during imaging to compensate for amplitude variations and thereby distance changes between the tip and the sample. By maintaining a constant amplitude and distance, Tapping mode reconstructs the sample topography from the Z scanner movement.
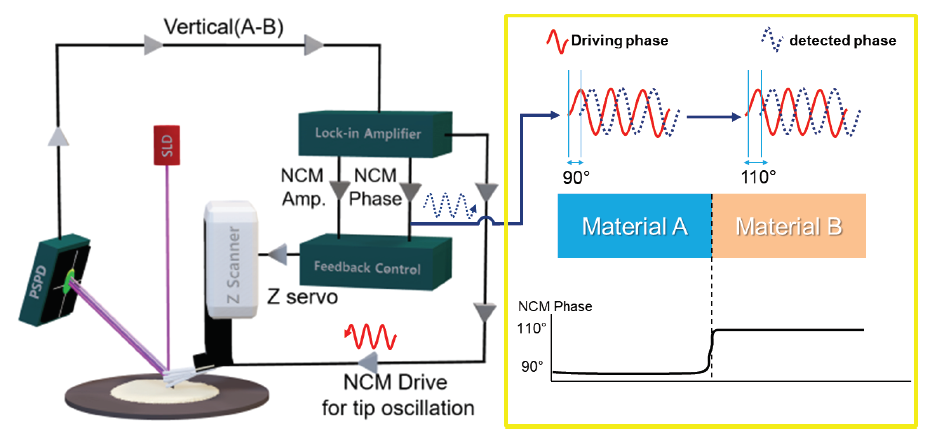
Figure 3. Schematic diagram of the experimental setup for Tapping mode. The phase between the detected cantilever oscillation and the drive signal gives a contrast between different materials and therefore carries additional information on the material distribution in the sample.
Figure 3 shows a schematic diagram of the experimental setup for Tapping mode. Besides topography measurements, Tapping mode allows imaging of the mechanical and material distribution via the phase signal: due to the intermittent tip-sample contact the phase of the cantilever oscillation with respect to the drive is sensitive to material-specific short-range interactions, such as elasticity, adhesion and stiffness (figure 3). Therefore, the phase signal can visualize mechanical and compositional inhomogeneities in samples. However, since several different effects simultaneously act on the phase signal, phase imaging is limited to qualitative information on the mechanical and material distribution. For quantitative nanomechanical imaging, refer to Park’s PinPoint nanomechanical mode. Figure 4 shows Tapping mode measurements on self-assembled molecule aggregates of the semi-fluorinated alkane F14H20 on a silicon substrate. The AFM height (a) and phase (b) imaged aggregates with sizes between 200 nm and 700 nm in diameter and 4 nm height. Since F14H20 structures are softer than the silicon substrate, they can be clearly distinguished in phase image. The zoom of the phase signal additionally reveals lamellar substructures within the molecule aggregates.
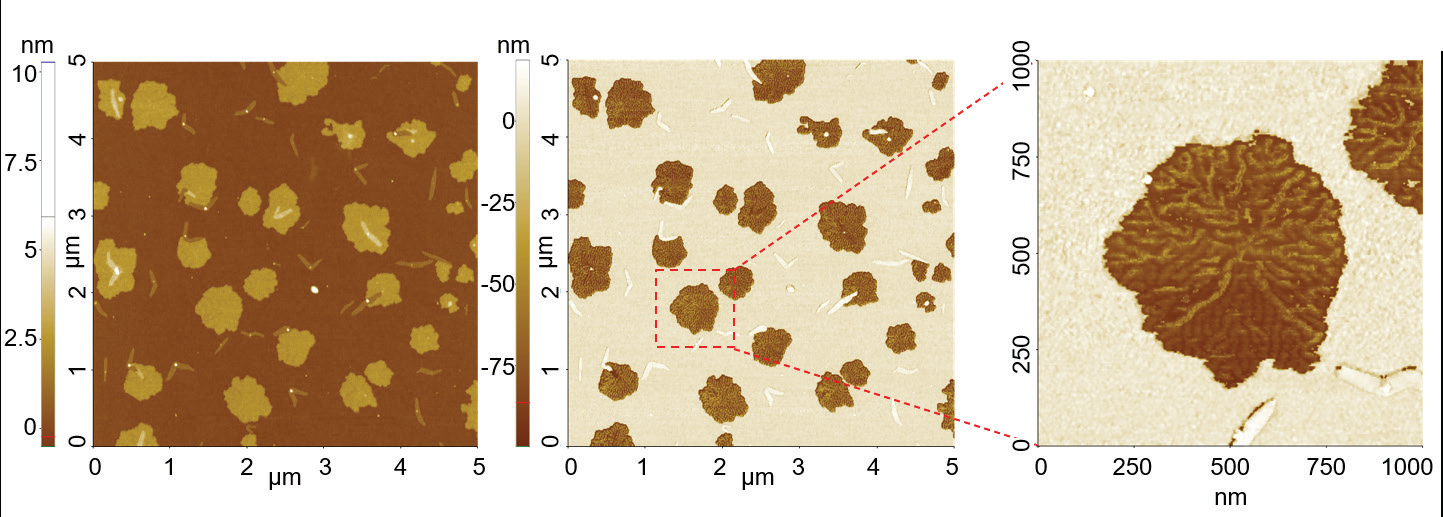
Figure 4. Tapping mode measurement on F14H20 molecular aggregates: AFM height (a), phase (b) with a 5 μm by 5 μm scan size and zoom in phase (c) of image (b) with a 1 μm by 1 μm scan size.
