There has been growing interest in thermal characteristics of devices and materials that incorporate nanostructured features. Scanning thermal microscopy (SThM) was developed to probe thermal properties at the nanoscale level. SThM uses nanofabricated thermal probes to achieve unprecedented high spatial and thermal resolution and sensitivity with a unique signal detection scheme. SThM is available in two modes, temperature contrast mode (TCM) and thermal conductivity contrast mode (CCM). TCM allows the user to measure the temperature variations on a sample surface, which has heat source on it. CCM allows the user to measure variations of thermal conductivity on a sample surface. Figure 1 shows the experimental setup of SThM. Main parts of the SThM are the SThM probe with a resistive element at the end of the tip and the Wheatstone bridge. The distance between tip and sample surface is controlled by Contact mode AFM feedback and the topographic information is measured directly from the cantilever deflection, which is independent from the sample’s thermal properties. Simultaneously to the topography scan, thermal CCM or TCM images can be collected. Here, the output voltage from the Wheatstone bridge is used as feedback to maintain a constant probe temperature (CCM) or measure the probe’s temperature changes (TCM).
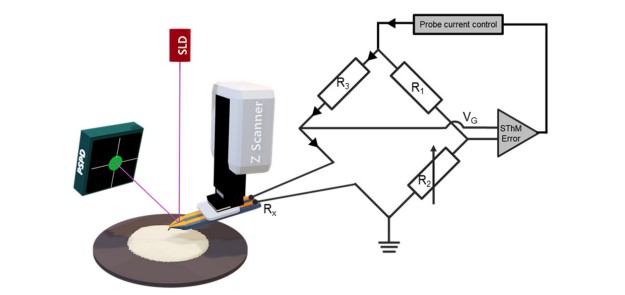
Figure 1. Schematic diagram of the experimental setup of SThM, with a nanothermal SThM probe connected to a Wheatstone bridge.
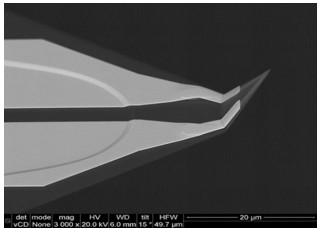
Figure 2. The SEM image of a SThM nanothermal probe
The key part of the SThM is the SThM tip, which serves as a resistance thermometer (or a heater in CCM) as it scans the sample surface. The Wheatstone bridge circuit controls the resistivity of the SThM tip according to the temperature of the surface and acquires the resistivity at each pixel of the scan. Previous wire-based thermal probes (e.g., Wollaston wire) could not provide sufficient spatial and thermal resolutions due to limited geometry of the wire. Improved SThM uses nanofabricated thermal probes, where a resistive element is lithographically patterned onto the AFM tip. Figure 2 shows a scanning electron microscopy (SEM) image of such a nanofabricated thermal probe with ~100 nm tip radius enabling a high-resolution thermal image scan. Using nanofabricated thermal probes, both TCM and CCM modes are available in SThM.
In TCM, the resistive element of the nanothermal probe is used as a resistance thermometer. As the tip scans the surface, the temperature of the thermal probe changes according to the surface temperature. This temperature change of tip leads to change of its resistance. Therefore, the local temperature of the sample surface below the tip can be measured by running a constant current, referred to as the ‘probe current’ through the probe to continuously measure the tip resistance as shown in figure 3 (a). The variable resistor in the bridge controls the current as the probe scans over the surface so that only very small amounts of current flows in the tip during the scan. Because of the resistance change by self-heating can cause errors in temperature measurement, the current passed through the probe in TCM has to be sufficiently small to prevent self-heating of the probe. During the scan, the change of the probe resistance alters the voltage balance of the Wheatstone bridge, which introduces an error signal in V that is referred to as ‘SThM error’. This SThM error, caused by the resistance change if the tip, is used to generate the SThM image in TCM and translates to the qualitative temperature distribution of the sample.
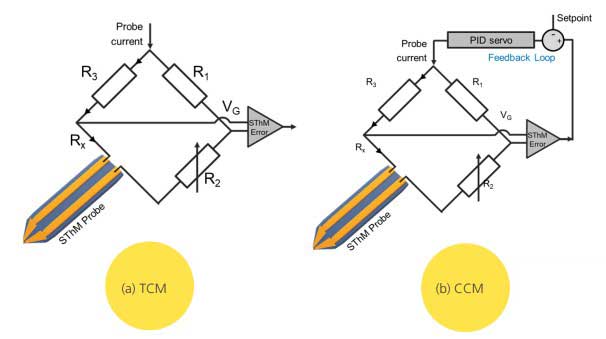
Figure 3. Schematic diagram of the TCM mode, where the SThM tip acts as resistance thermometer to detect temperature changes in
the sample (a) and CCM mode (b), where the SThM tip acts as resistive heater and an additional thermal feedback maintains a constant
tip temperature as heat flows from the tip to the sample.
In CCM, the resistive element of the nanothermal probe is used as a resistive heater. A sufficiently high current is applied to the probe tip to keep it at a set temperature via an additional thermal feedback loop. The energy required to maintain the set temperature represents the local thermal conductivity. When the thermal conductivity of the sample is high, the heat flow from tip to sample is fast and the system needs more energy to maintain the constant temperature due to the large heat dissipation. Schematic diagram of the CCM is shown in figure 3 (b). In CCM mode, the probe temperature has to be higher than the sample temperature to assure that heat only flows from the probe to the sample, resulting in the heat dissipation of the probe. The thermal feedback senses this heat dissipation as change in the tip resistance, balances the bridge voltage accordingly, and restores the probe’s resistance. The thermal conductivity of the sample is proportional to the heat flow from tip to sample. Thus, the detected variations in heat flow can be used to image changes in thermal conductivity of the sample.
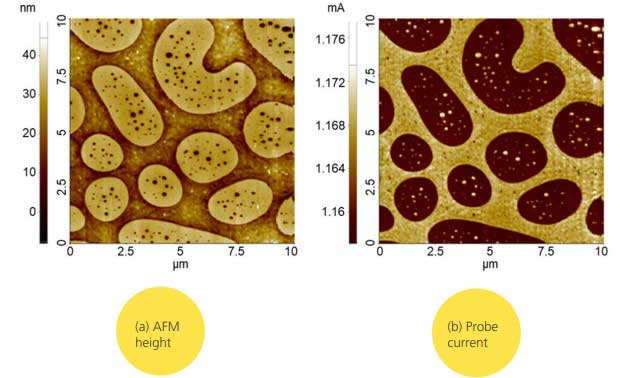
Figure 4. AFM height (a) and probe current, which represents the thermal conductivity,
(b) were measured on the PS/LDPE surface by the CCM mode in SThM with nanothermal probe.
SThM can be used to distinguish material variations of polymeric composite samples based on their thermal conductivity as shown in figure 4. Here, a blend of amorphous (atactic) polystyrene (PS) and low-density polyethylene (LDPE) on Si substrate was characterized via SThM. LDPE is a semicrystalline polymer formed of crystalline lamellae, which is embedded in amorphous PS. Topography (figure 4 (a)) and qualitative thermal conductivity image (figure 4 (b)) of PSLDPE were measured with CCM mode without an additional heat source. In the probe current image of figure 4 (b), the material differences between PS, which has a lower thermal conductivity, and LDPE, with a higher thermal conductivity can be distinguished clearly. Figure 5 (see next page) shows TCM measurement on a pole-tip-recession (PTR) of a hard disk drive (HDD) head to study the sample heating as power is applied on either the writer or the reader. Writer (area A) and reader (area B) are marked on the topography in figure 5 (a). The SThM error image in (b) represents the initial qualitative surface temperature distribution on the sample without application of power, featuring a homogeneous temperature distribution. However, upon the application of power to either the writer in figure 5 (c), or the reader in figure 5 (d), the surface temperature on respective area increases compared to the surroundings. Thus, SThM could visualize the increase of the surface temperature caused by the application of power to writer or reader. Due to the linear correlation between the SThM error and the tip temperature, the SThM error can be converted to absolute temperature values by calibrating with a temperature control stage (TCS). The SThM tip detects the SThM error as the temperature of the TCS increases as shown in figure 6 (a), and a linear fit equation is used to calculate the calibration factor from the temperature vs. SThM error plot. After this calibration, the calibration factor can be applied to calculate the surface temperature on samples with unknown temperature as shown in figure 6 (c).
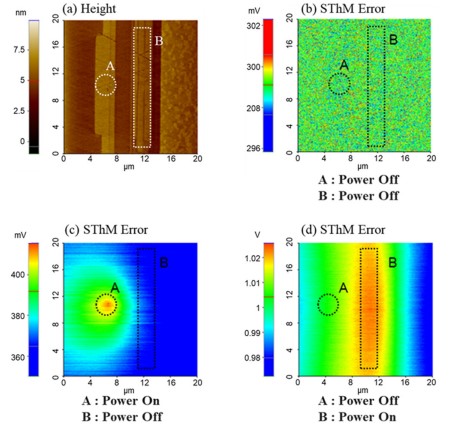
Figure 5. AFM height on the PTR of the HDD head (a), SThM image without power applied to the sample (b),
SThM image with power on the writer (area A) (c), and SThM image with power on the reader (area B)
(d) shows the increases temperature on the respective areas.
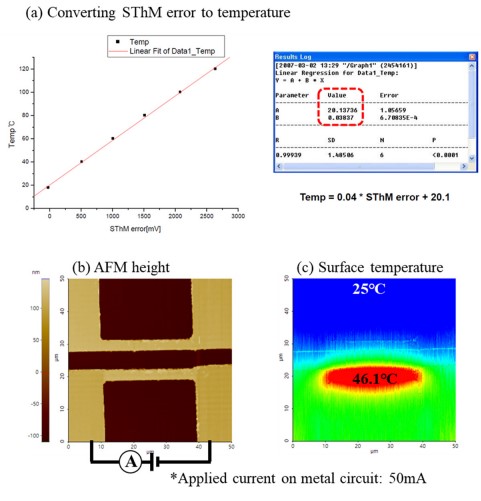
Figure 6. Calibration process to convert the SThM error to absolute temperature values using a TCS (a),
AFM height image (b) and calculated surface temperature from the SThM error (c) on a metal heater.
