In addition to topographic imaging, Atomic force microscopy (AFM) is routinely used to resolve mechanical properties of various samples for material and life science on the nanometer scale. An established technique to probe nanomechanical properties is Force modulation microscopy (FMM). FMM is based on contact mode AFM with an additional mechanical modulation that is applied to the cantilever during the contact scan. The mechanical modulation of the AFM cantilever leads to an oscillating tipsample force, facilitating the characterization of the sample’s nanomechanical properties based on the amplitude and phase shift of the cantilever modulation. The FMM amplitude and phase are sensitive to changes in the local elasticity, friction, and adhesion force between the tip and sample surface. Therefore, FMM acquires images of the sample topography simultaneously to local nanomechanical properties that allow a qualitative differentiation of material components in composite samples, such as polymer blends.
To introduce the mechanical modulation of the cantilever, the drive piezo applies the periodic vertical oscillation, called ‘drive signal’ at a predefined frequency. Whereas in True Non-contact and Tapping mode, the amplitude of the oscillating cantilever is in the range of 10 to 50 nm, empirically, FMM employs smaller amplitudes below 10 nm to prevent tip and sample damage. For soft samples, cantilevers with a low force constant are recommended.
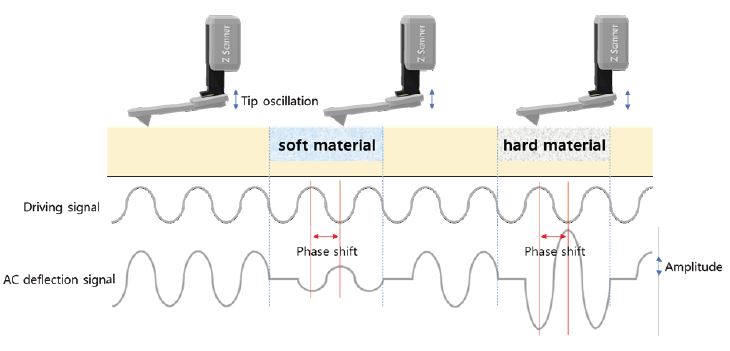
Figure 1. Schematic working principle of FMM. While the tip scans the surface in contact mode, applies a vibrating mechanical drive signal to the tip. The FMM amplitude and phase of the detected AC deflection resolve special variations of the sample’s nanomechanical properties.
The cantilever deflection signal measured in FMM consists of DC and AC components. The DC signal represents the average cantilever deflection, comparable to the static deflection in contact mode, and is used by the Z feedback to maintain a constant average force between the tip and sample and thereby generating the topography image. The AC signal contains the sample response to the force modulation and, thus, the nanomechanical information, as shown in figure 1. The amplitude of this AC signal, the FMM amplitude, is sensitive to the sample stiffness: hard surfaces amplify the oscillation by deflecting the modulation and the amplitude increases as a result, whereas soft surfaces partially absorb the oscillation and the amplitude decreases. The phase shift between drive and the detected modulated cantilever deflection, the FMM phase, depends on adhesion and elastic properties of the sample. Typically, the FMM phase is more sensitive to elastic properties of the surface than the FMM amplitude.
A common application of FMM is to distinguish variations in the material distribution of polymer composites. Figure 2 shows an FMM measurement of a blend of amorphous polystyrene (PS) and low-density polyethylene (LDPE) on a Si substrate. The AFM height image in figure 2 (a), measured simultaneously to the FMM signals in figure 2 (b) and (c), displays the surface topography with structural differences between the two constituent polymers. The FMM amplitude and FMM phase, on the other hand, image the distribution of PS and LDPE on the sample surface with a distinct contrast: the bright area of the FMM amplitude in figure 2 (b) indicates the harder compound PS, while the dark area represents LDPE, which is softer than PS and, therefore, has a lower FMM amplitude. Compared to the topography, the FMM images allow the identification of each of the compounds based on their different nanomechanical properties. Thus, FMM provides more detailed information on the composition and material distribution in composite samples.
Figure 2. FMM measurement on a PS-LDPE blend visualizes the composite distribution based on the nanomechanical properties of the polymers. (a) AFM height shows different surface topography of both polymers, (b) FMM amplitude and (c) FMM phase allow the identification of the hard PS (bright areas in FMM amplitude and dark areas in FMM phase) and the softer LDPE (dark areas in FMM amplitude and bright areas in FMM phase).
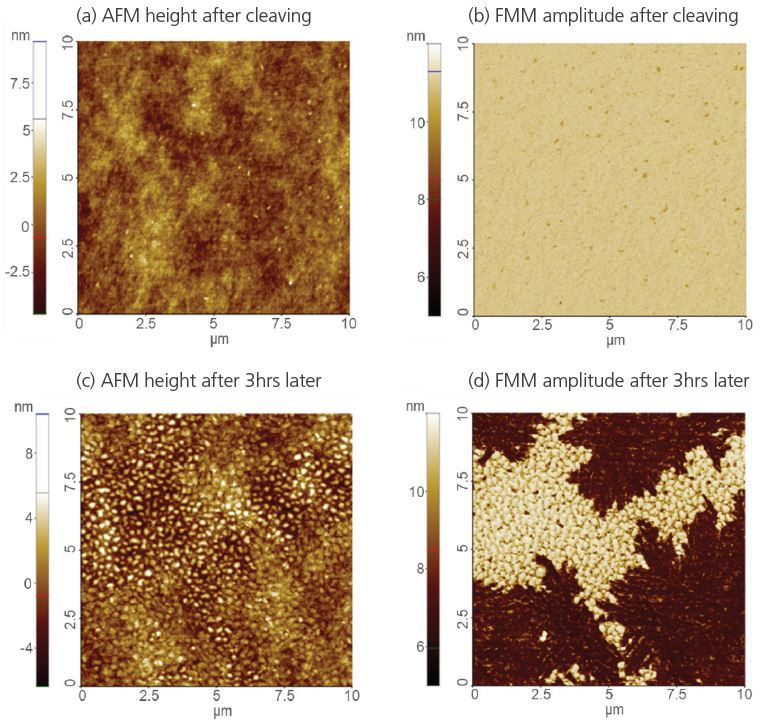
Figure 3. FMM measurements on a crystal facet surface at different times after cleaving reveals the degradation of the pristine surface upon exposure to air and humidity based on qualitative mechanical information. AFM height and FMM amplitude right after cleaving (a) and (b), and after 3hrs later (c) and (d) respectively.
Figure 3 shows an additional mechanical property study on crystal facets using FMM. First, the topography and FMM response of a freshly cleaved sample surface was measured. Subsequently, the crystal facet was exposed to air and humidity. After 3 hours of exposure, the qualitative mechanical properties of the surface were probed via FMM in the same position to resolve changes in the surface composition. The FMM amplitude in figure 3 (d) clearly captured the formation of a softer compound as dark amplitude contrast on the pristine crystal surface.
Besides FMM mode, which is used to image the material distributions based on qualitative mechanical properties, quantitative mechanical properties are provided by force-distance (FD) spectroscopy-based techniques such as FD volume imaging and PinPoint nanomechanical mode. (see “FD mode note” and “PinPoint nanomechanical mode note” for more information about quantitative mechanical property measurements).


